
जल संसाधन प्रबंधन में अध्ययन करने का कार्य, जल संसाधन प्रबंधन और ग्रामीण प्रौद्योगिकी केंद्र द्वारा किया जाता है। संसाधन मॉडलिंग और विश्लेषण, केंद्र की मुख्य क्षमताएं हैं। समूह का उद्देश्य वैज्ञानिक और औद्योगिक अनुसंधान एवं विकास को लागू करना है जो वाटरशेड और बंजर भूमि विकास, वर्षा जल संचयन, जल संसाधन प्रबंधन, सिंचाई में सुधार, ग्रामीण रोजगार, आर्थिक विकास के माध्यम से देश के लोगों के लिए आर्थिक, पर्यावरणीय और सामाजिक लाभों को अधिकतम करता है। आदिवासी समुदाय का. समूह की गतिविधियाँ निम्नलिखित चित्र में दी गई हैं:
ग्रामीण जल संसाधन प्रबंधन के लिए भूजल स्तर में बदलाव के कारण मिट्टी के व्यवहार में बदलाव की मॉडलिंग
अध्ययन में उपकरणीकरण के लिए दो अध्ययन स्थलों का चयन किया गया। चयनित स्थल में से एक उथले भूजल स्तर से संबंधित है और दूसरा स्थल गहरे भूजल क्षेत्र में आता है। दोनों चयनित स्थल मप्र के होशंगाबाद जिले के तवा नदी जलग्रहण क्षेत्र के अंतर्गत आते हैं। प्रत्येक साइट पर मिट्टी की नमी और तापमान की नियमित निगरानी के लिए उपकरण लगाए गए थे। स्थापित उपकरणों में सेंसर (मिट्टी की नमी और तापमान सेंसर) से जुड़े डेटा लॉगर होते हैं। ये सेंसर अलग-अलग गहराई (5, 7 और 10 फीट) पर तैनात हैं और लगातार डेटा को सेंस कर रहे हैं। डेटा उत्पादन के बाद विश्लेषण किया गया और मिट्टी प्रोफ़ाइल के भीतर मिट्टी की नमी/तापमान के बीच संबंध स्थापित किया गया (चित्र 5)। इसके अलावा इन परीक्षण स्थलों पर पास के खोदे गए कुएं में जल स्तर की गहराई की नियमित रूप से निगरानी की जाती है। इसके अलावा भूजल स्तर के मौसमी उतार-चढ़ाव का निरीक्षण करने के लिए जलक्षेत्र में विभिन्न स्थानों पर खोदे गए/बोरवेलों में मानसून से पहले और बाद में जल स्तर की गहराई (चित्र 1 और 2) दर्ज की गई है।
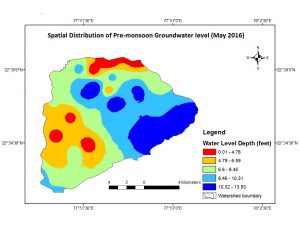
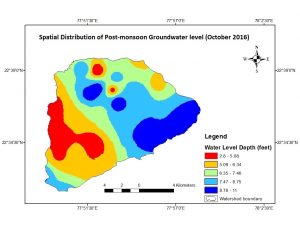
Fig.1: Pre-monsoon Depth to water level (May2016) Fig.2:Post-monsoon Depth to water level (Oct.2016)
मिट्टी की नमी जांच (चित्र 3) की मदद से वाटरशेड के विभिन्न स्थानों पर सतही मिट्टी की नमी को मैन्युअल रूप से मापा गया। मिट्टी की नमी और मिट्टी की बनावट के विश्लेषण के लिए मिट्टी का नमूना लिया गया और उसे प्रयोगशाला में ले जाया गया। इसके अलावा, मई 2016 से जनवरी 2017 के दौरान उपग्रह और इन-सीटू अवलोकनों से भूमि की सतह का तापमान (एलएसटी) मानचित्रण किया गया था। एलएसटी मानचित्र (चित्र 4) जलसंभर में भूमि की सतह के तापमान का स्थानिक वितरण दर्शाता है। उपग्रह से प्राप्त और यथास्थान प्रेक्षित भूमि की सतह के तापमान के बीच संबंध विकसित किया गया (चित्र 6)।
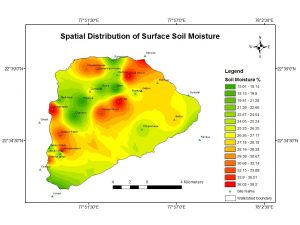
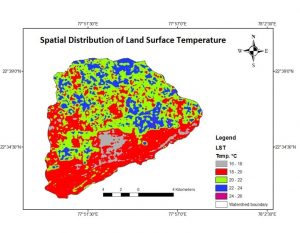
Fig3: Surface soil moisture (Oct.2016) Fig.4: Land surface temperature (Dec.2016)
“स्वच्छ जल: टिकाऊ विकल्प, कृषि जलसंभर में पोषक तत्वों और कीटनाशक प्रदूषण के आकलन और प्रबंधन के लिए स्थानिक निर्णय समर्थन प्रणाली (एसडीएसएस) और हाइड्रोलॉजिकल मॉडलिंग का विकास”
परियोजना कार्य के दौरान जलग्रहण क्षेत्र के विभिन्न स्थानों पर मानसून पूर्व और मानसून पश्चात जल के नमूने लिए गए और प्रयोगशाला में उनका विश्लेषण किया गया। पानी के जिन मापदंडों का विश्लेषण किया गया उनमें पीएच, टीडीएस, ईसी, फॉस्फेट, आयरन, मैंगनीज, क्लोरीन, सल्फाइड, सल्फेट, नाइट्रेट और फ्लोराइड शामिल हैं । प्रत्येक पैरामीटर का एक बारग्राफ बनाया गया जो भूजल में मौजूद उस पैरामीटर की सांद्रता को प्रदर्शित कर रहा है। जल विश्लेषण के परिणामों से पता चला है कि कुछ स्थानों पर लोहा अनुमेय सीमा (> 0.3 पीपीएम) से ऊपर मौजूद है। जल विभाजक के कई स्थानों पर मैंगनीज अनुमेय सीमा (> 0.1 पीपीएम) से अधिक पाया जाता है। कुछ स्थानों पर स्वीकार्य सीमा से ऊपर नाइट्रेट भी पाया गया। विश्लेषण किए गए अन्य पैरामीटर सामान्य सीमा में पाए गये। इसके अलावा, वहां फसलों और सब्जियों पर लगाए जाने वाले कीटनाशकों, कवकनाशी और उर्वरकों के बारे में जानकारी एकत्र की गई। कई स्थानों पर भूजल पर प्रभाव का पता लगाया गया है, जो यह सुनिश्चित करता है कि कुछ रसायन और पोषक तत्व मिट्टी से निकल रहे हैं और नियमित रूप से भूजल में मिल जाते हैं।